It has been more than two years since the publication of the ‘Ship Market Trend.’ The data quoted in the book was as of 2016. Now we have entered 2019, the full year’s data of 2017 and 2018 are available. If the method introduced in the book is correct, then the new data should be able to verify the relationship between the data and correctly reflect it in the extended chart.
To this end, we first systematically use the new data to test the methods as described in the book after the publication of this book, and surprisingly found that the new intersection perfectly matched. It means history is constantly repeating, these historic data can help us predict the future.
Below we will share with you the extended chart according to the additional data, you can open the book to compare each of the following figures to see the trend of dry bulk carriers, tankers and container ships.
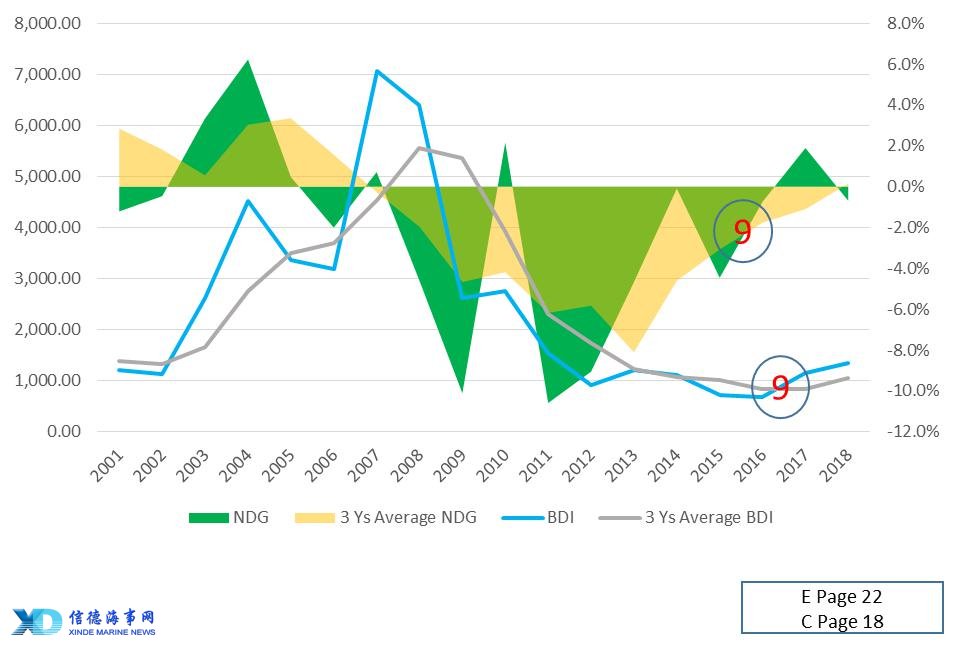
1. The charter rate/earnings are strongly linked with the NDG. When the NDG is getting better, it means the demand growth rate is higher than the fleet growth rate, so NDG moves up. This brings up the momentum and drives the charter rate/earnings higher. When the demand growth rate is smaller than the fleet growth rate, the NDG moves down: the downside momentum will drive the charter rate/earnings lower.
a.Let’s start with Dry Cargo ship, in English version page 22, and Chinese version page 18, with additional 2017 and 2018 data, at point 9, BDI blue line follow the trends successfully up crossed its last three years average.
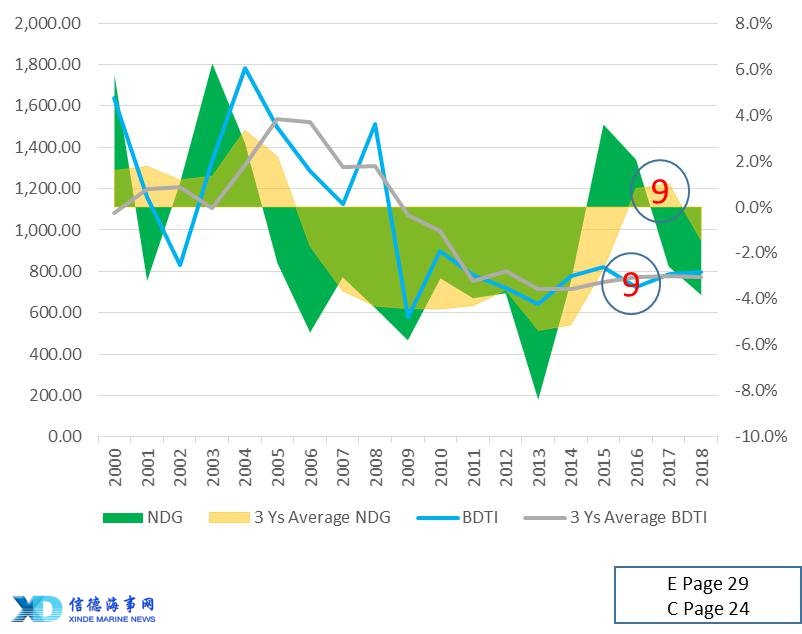
b.Tanker market, in English version page 29, and Chinese version page 24, with additional 2017 and 2018 data, at point 9, NDG follow its trends down crossed its last three years average.
c.Container ship, in English version page 36, and Chinese version page 30, with additional 2017 and 2018 data, at point 8, NDG and CACE follow their trends down crossed their last three years averages.

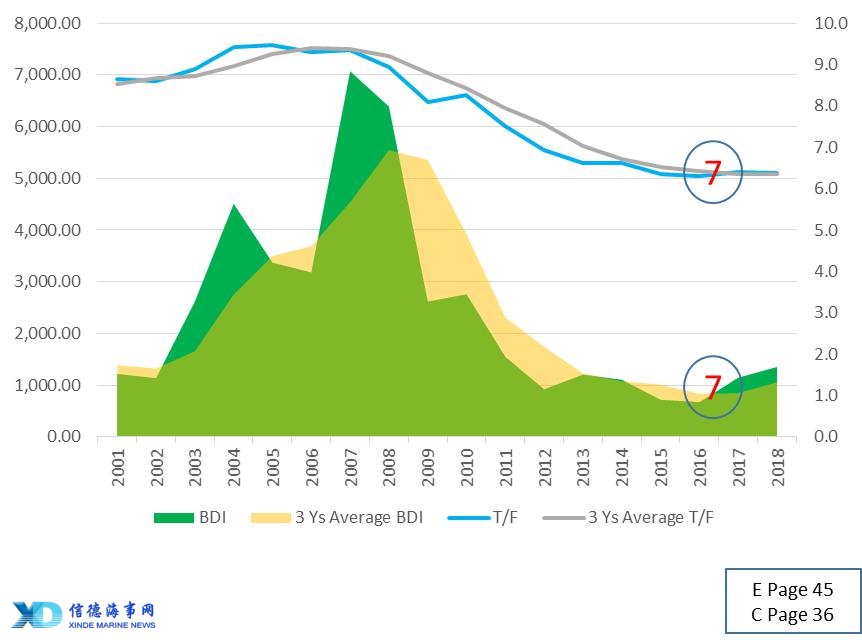
2. T/F ratio is deciding the level of charter rate/earnings market. When the T/F ratio moves up, charter rate/earnings have a high possibility of moving up. When the T/F ratio moves down, charter rate/earnings have a high possibility of moving down. However, in the different market periods, the T/F ratio has a different scale of influence on the charter rate/earnings.
a.Let’s start with Dry Cargo ship, in English version page 45, and Chinese version page 36, with additional 2017 and 2018 data, at point 7, T/F and BDI follow their trends up crossed their last three years averages.
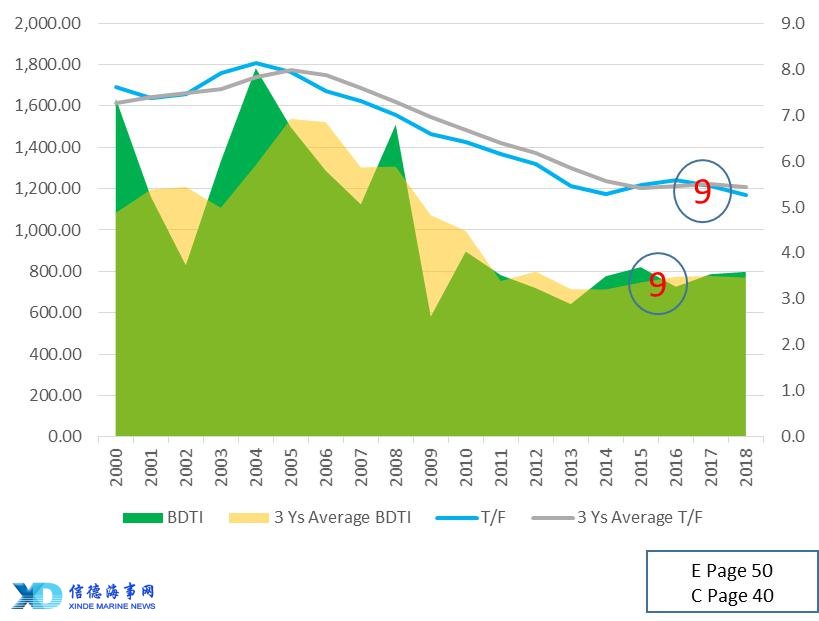
b.Tanker market, in English version page 50, and Chinese version page 40, with additional 2017 and 2018 data, at point 9, T/F and BDTI follow their trends down-crossed their last three years
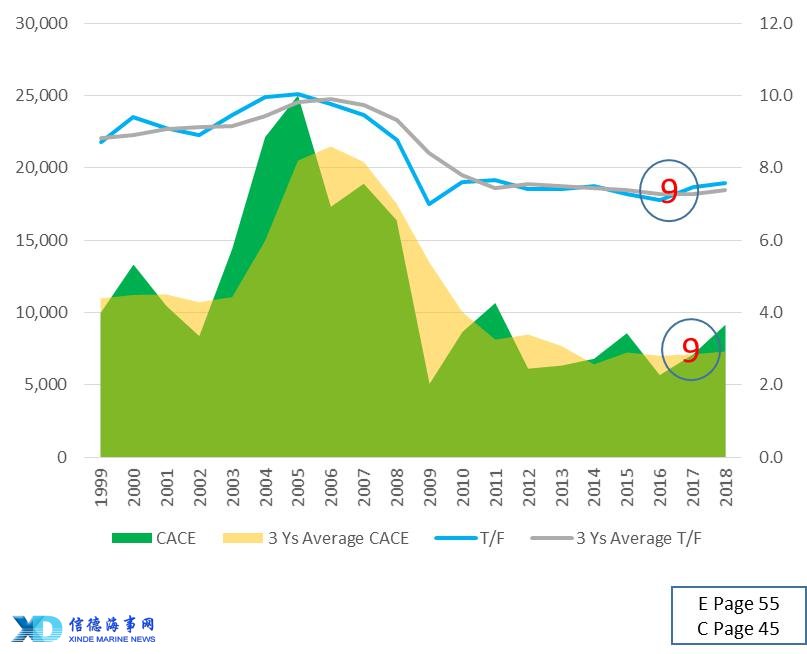
c.Container ship, in English version page 55, and Chinese version page 45, with additional 2017 and 2018 data, at point 9, T/F and CACE follow their trends up crossed their last three years averages.
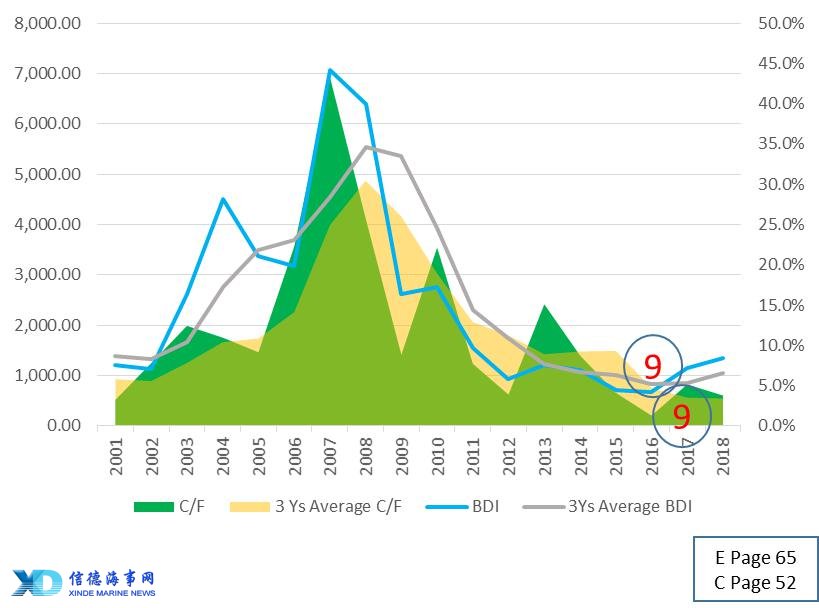
3. When the charter rate/earnings get better, ship owners are willing to commit to ordering new building, hence pushing the C/F ratio to a high level, and when the charter rate/earnings are low, ship owners are less interested in committing to ordering new building; hence the C/F ratio will be brought to a low level.
a.Let’s start with Dry Cargo ship, in English version page 65, and Chinese version page 52, with additional 2017 and 2018 data, at point 9, C/F and BDI follow their trends up crossed their last three years averages.
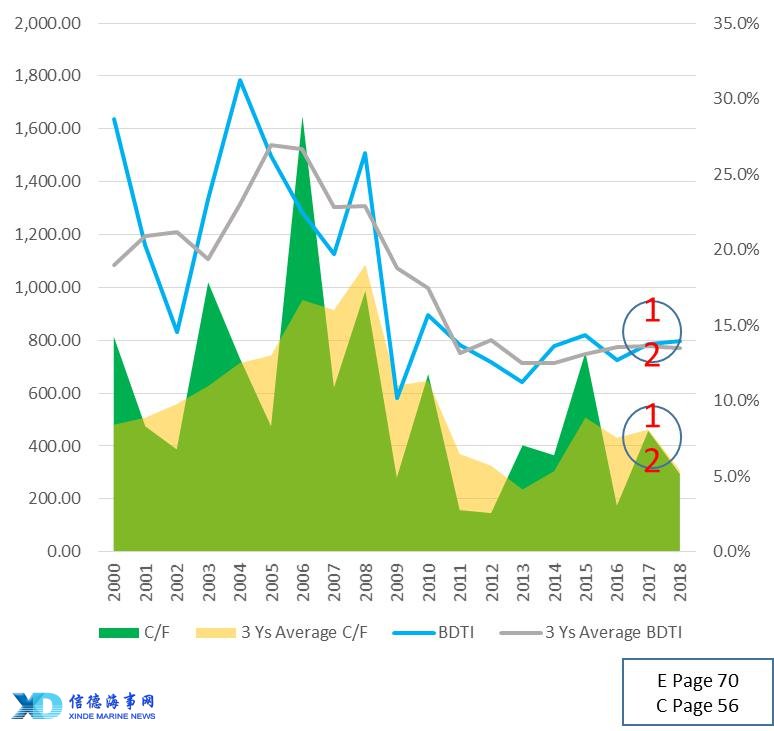
b.Tanker market, in English version page 70, and Chinese version page 56, with additional 2017 and 2018 data, at point 12, C/F and BDTI follow their trends up crossed their last three years averages.
c.Container ship, in English version page 75, and Chinese version page 61, with additional 2017 and 2018 data, at point 13, C/F and CACE follow their trends up crossed their last three years averages.

4.D/F ratios move a few years later in relation to the C/F ratio. When the C/F ratio is high, it will have a high D/F ratio in the future. Delivery is almost unrelated to the current year’s market charter rate/earnings.
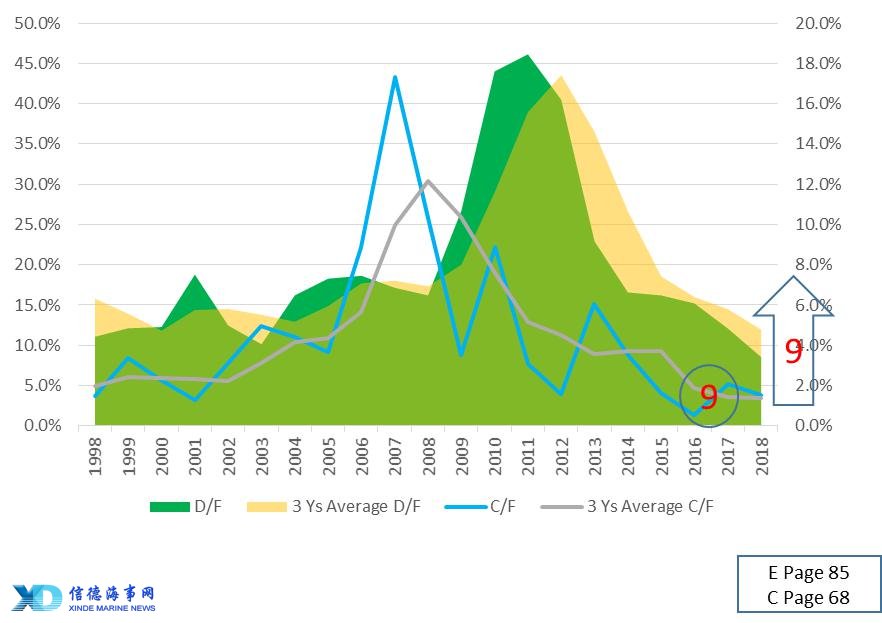
a.Let’s start with Dry Cargo ship, in English version page 85, and Chinese version page 68, with additional 2017 and 2018 data, at point 9 where D/F is about few years lag C/F, C/F and D/F follow their trends up crossed their last three years averages.
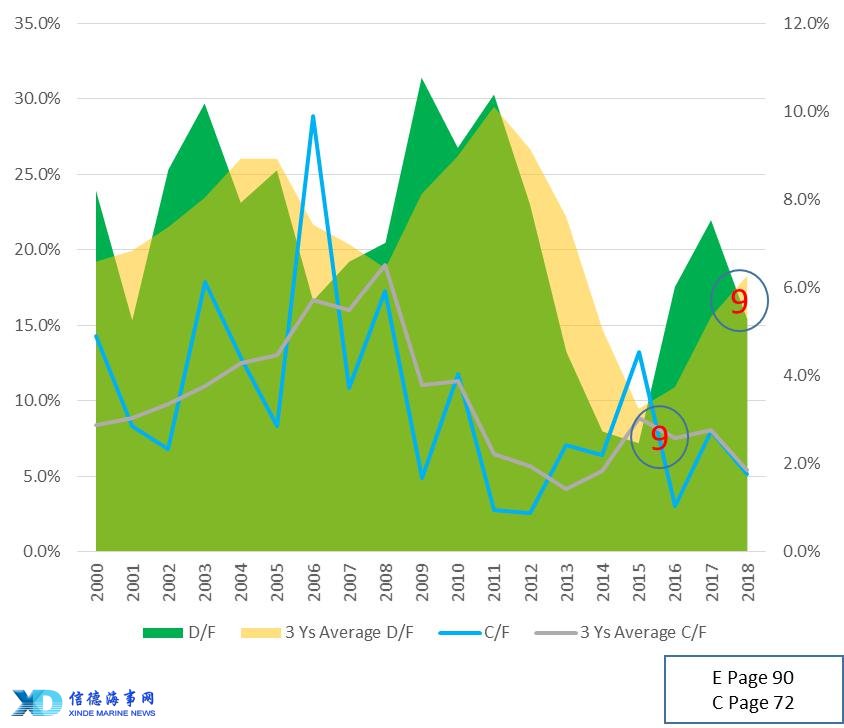
b.Tanker market, in English version page 90, and Chinese version page 72, with additional 2017 and 2018 data, at point 9 where D/F is about few years lag C/F, C/F and D/F follow their trends down crossed their last three years averages.
c.Container ship, in English version page 95, and Chinese version page 77, with additional 2017 and 2018 data, at point 9 where D/F is about few years lag C/F, C/F and D/F follow their trends up crossed their last three years averages.

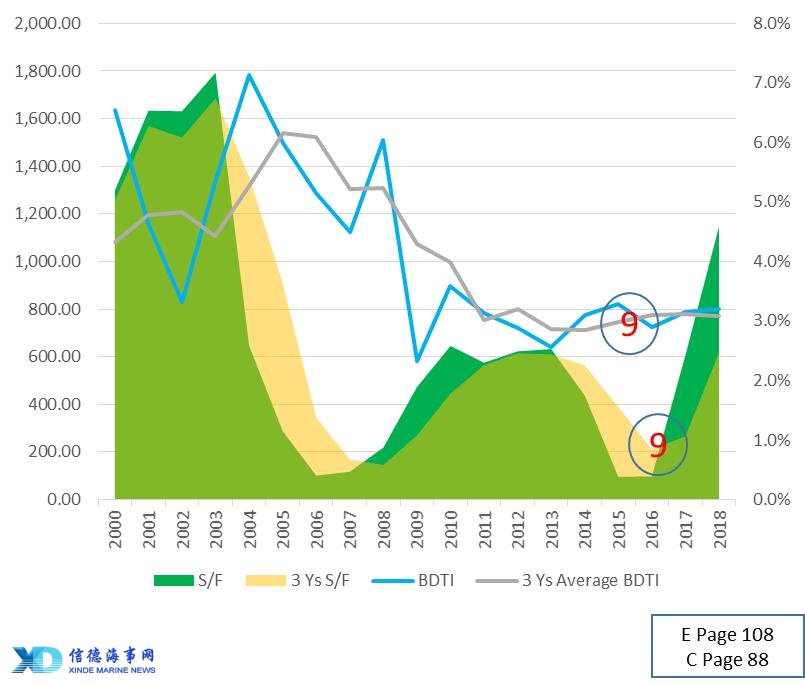
5.S/F ratio moves reversely with charter rate/earnings. When charter rate/earnings are getting better, ship owners are not willing to scrap their old ships and this will result in a low S/F ratio. When charter rate/earnings are low, owners are keen to scrap their ships, and the S/F ratio will move up.
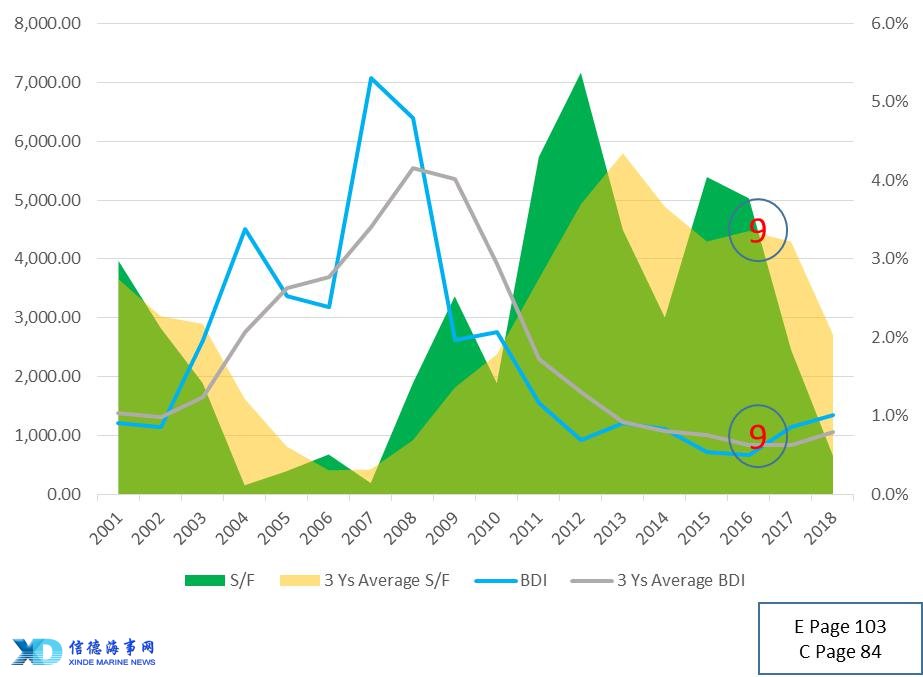
a.Let’s start with Dry Cargo ship, in English version page 103, and Chinese version page 84, with additional 2017 and 2018 data, at point 9, S/F and BDI follow their trends oppositely crossed their last three years averages.
b.Tanker market, in English version page 108, and Chinese version page 88, with additional 2017 and 2018 data, at point 9, S/F and BDTI follow their trends oppositely crossed their last three years averages.
c.Container ship, in English version page 113, and Chinese version page 93, with additional 2017 and 2018 data, at point 9, S/F and CACE follow their trends oppositely crossed their last three years

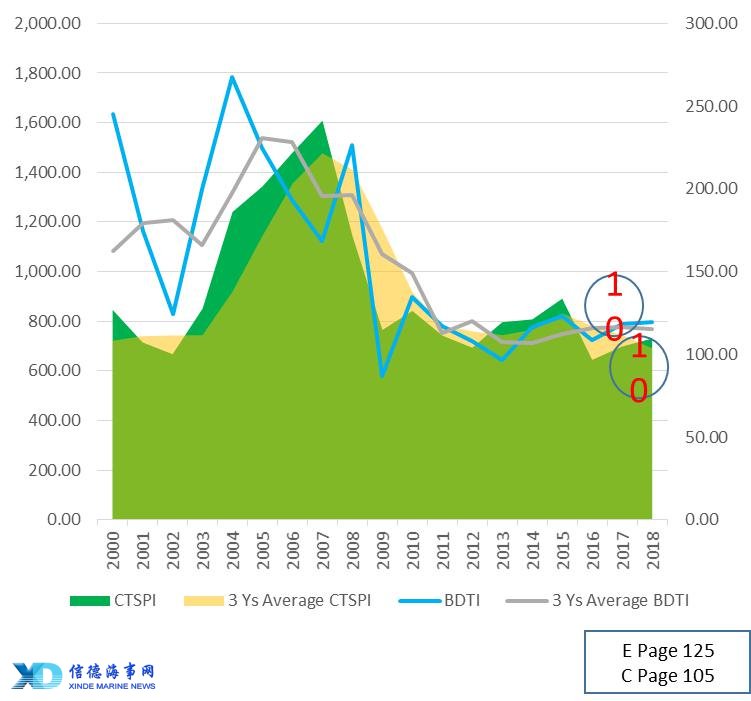
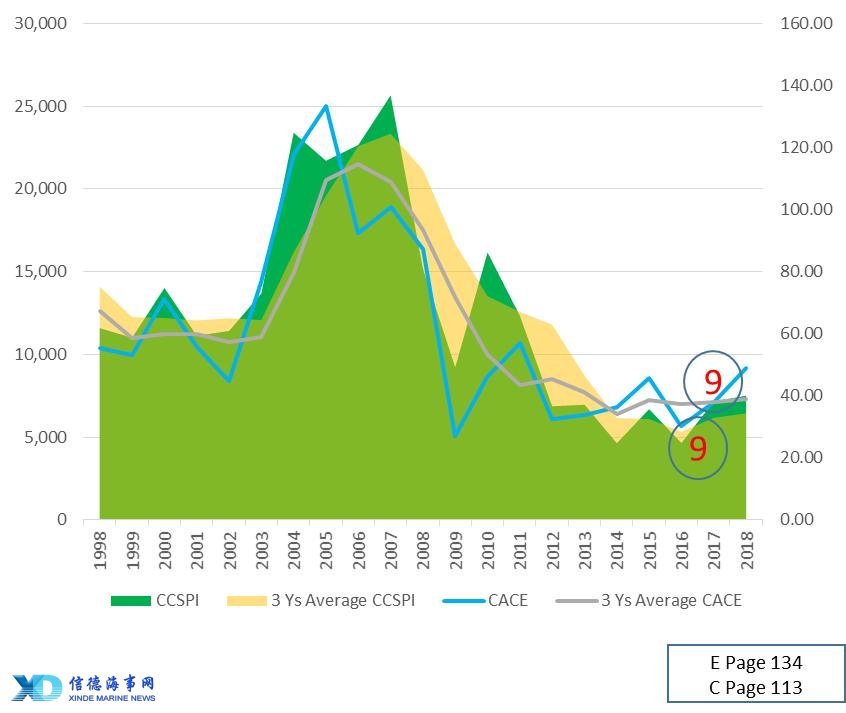
6.Charter rate/earnings have a very strong relationship with second hand asset price. When charter rate/earnings are getting better, ship owners are willing to commit to buying a second hand asset and this will push the asset price up, resulting in a high second hand asset price. When charter rate/earnings are low, second hand asset price will drop as there is less buying interest in the market, resulting in a low second hand asset price.
a.Let’s start with Dry Cargo ship, in English version page 120, and Chinese version page 100, with additional 2017 and 2018 data, at point 9, CBSPI and BDI follow their trends up crossed their last three years averages.

b.Tanker market, in English version page 125, and Chinese version page 105, with additional 2017 and 2018 data, at point 10, CTSPI and BDTI follow their trends up crossed their last three years averages.
c.Container ship, in English version page 134, and Chinese version page 113, with additional 2017 and 2018 data, at point 9, CCSPI and CACE follow their trends up crossed their last three years averages.
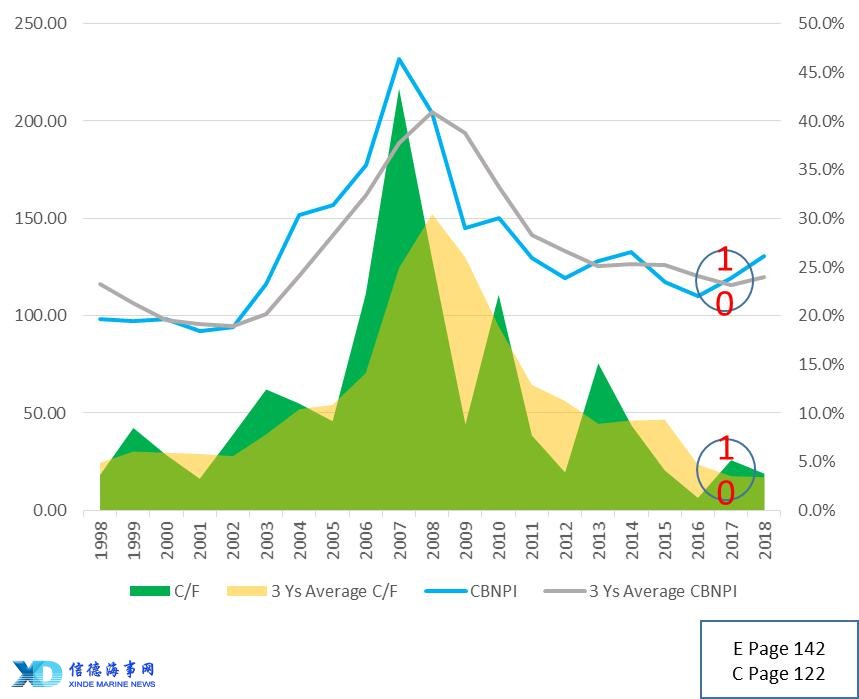
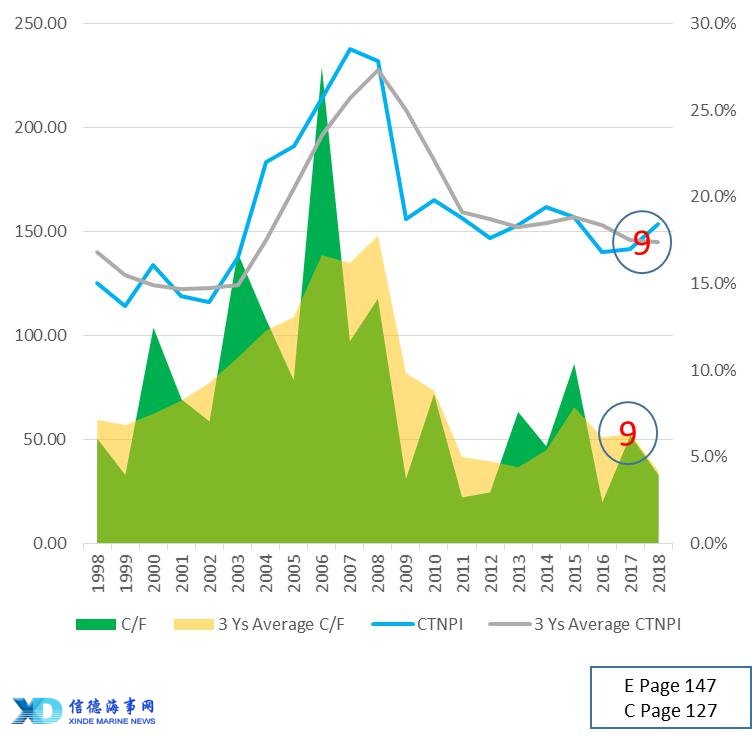
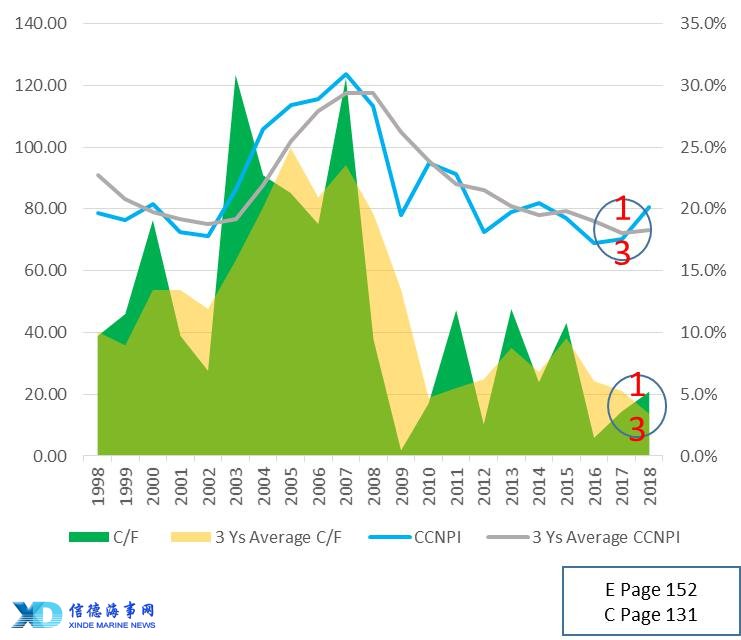
7. When the C/F ratio is getting better, the new building price will move up; when the C/F ratio is low, the new building price will move down.
a.Let’s start with Dry Cargo ship, in English version page 142, and Chinese version page 122, with additional 2017 and 2018 data, at point 10, CBNPI and C/F follow their trends up crossed their last three years averages.
b.Tanker market, in English version page 147, and Chinese version page 127, with additional 2017 and 2018 data, at point 9, CTNPI and C/F follow their trends up crossed their last three years averages.
c.Container ship, in English version page 152, and Chinese version page 131, with additional 2017 and 2018 data, at point 13, CCNPI and C/F follow their trends up crossed their last three years averages.
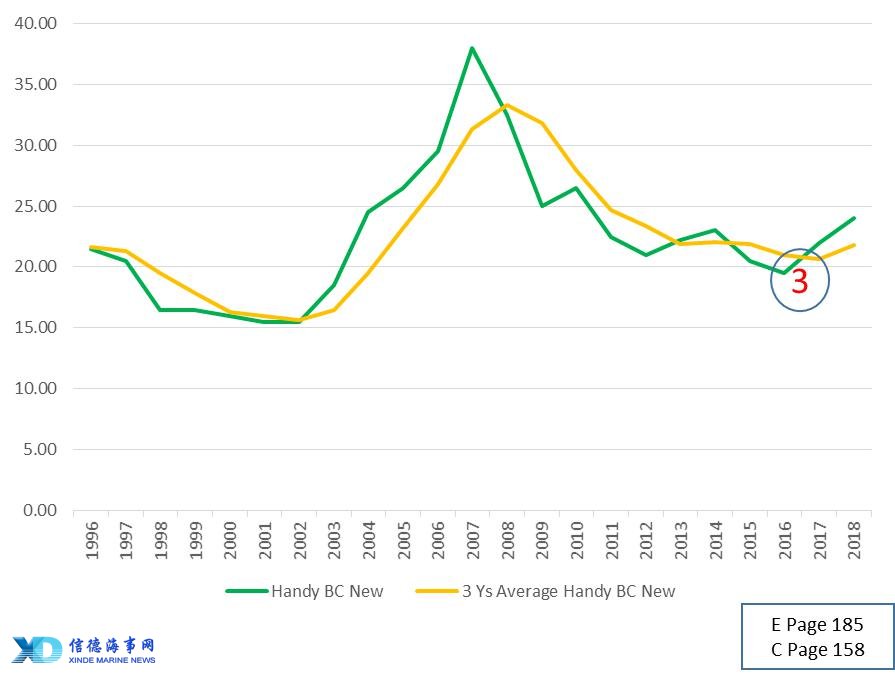
8. The current market always moves with the short, middle and long-term average. In most cases, when market moves up, the current market tends to move above their average. When market moves down, the current market tends to move below their average. When current data crosses its average data, and its average data is changing direction, there is high possibility that the market is going to change. Market average is the signal of the trend of ship market movement.
The whole section is divided into short, middle and long-term three subsections. Their principles and trends are almost in full compliance with the above rules. Let's take the long-term Handysize bulk carrier new ship price as an example. In the English version at 185 page, the Chinese version at 158 page, with additional 2017 and 2018 data, the current value up crossed its last three years average at point 3, then the current value has always moved above its averages.
After testing all the prediction methods with the newly added data, it was found to be a fairly complete good result. Now, you can use it frequently and accurately predict the trend of the ship market.
You can buy this book at Xinde Maritime, Amazon and Hong Kong bookstores. Below are their links.
Data from Clarksons and Baltic
Please Contact Us at:
admin@xindemarine.com


.gif)


 Ningbo Containerized Freight Index Weekly Commentar
  Ningbo Containerized Freight Index Weekly Commentar
  BIMCO Shipping Number of the Week: Bulker newbuildi
  Ningbo Containerized Freight Index Weekly Commentar
  Ningbo Containerized Freight Index Weekly Commentar